California K12 Collaborative Network Inventory
Research in Brief
Identifying the collaborative educational networks in California is both an art and science. Collaborative networks are diverse, and consequently resist classification. Further, while collaboration may occur in informal settings, only formalized partnerships with a critical mass of coordination or funding establish an online presence. It is this ineffability of educational networks that makes them difficult to identify and leads to duplication of effort as individual institutions work unaware of what other parties strive to accomplish
 This report, prepared at the Center for Applied
Policy in Education with funding from the Stuart Foundation,
identifies exemplars of collaborative networks. This inventory of
61 collaborative networks providing an initial map of the
collaborations currently functioning in California. This
catalogue of collaborative networks is organized into five
categories based on participant type, including: county, higher
education and K-12, regional, inter-county, and inter-district
networks.
This report, prepared at the Center for Applied
Policy in Education with funding from the Stuart Foundation,
identifies exemplars of collaborative networks. This inventory of
61 collaborative networks providing an initial map of the
collaborations currently functioning in California. This
catalogue of collaborative networks is organized into five
categories based on participant type, including: county, higher
education and K-12, regional, inter-county, and inter-district
networks.
County networks include those in which a local county office of education facilitates collaboration among constituent districts. Higher education and K-12 partnerships primarily comprise one or more K-12 school districts and engaged higher education partner(s). Regional networks exist statewide and maintain clusters of collaboration designated by region. Finally, the remaining districts types – inter-county and inter-district – describe collaborations among multiple educational agencies, either counties or districts.
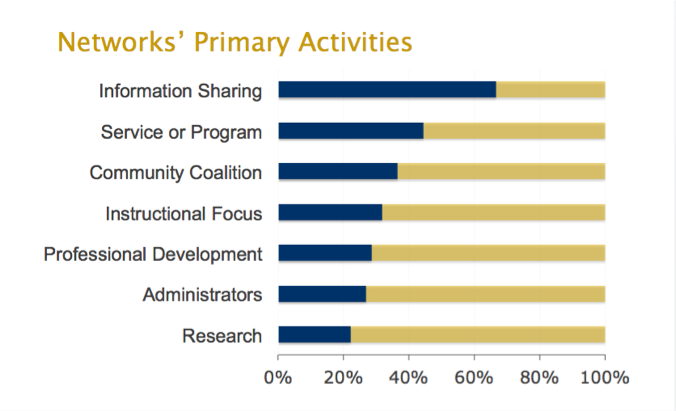
In addition to identifying collaborative networks, the report also describes the primary activities driving each network. As the figure above summarizes, information sharing was the most common activity within networks. Over 60% of collaborative networks participated in information sharing. In the figure, each topic represents an activity area (e.g. organizing Services or Programs) of the target participant (e.g. Administrators). The percentages reflect the number of networks engaging in a given of activity—activities are not mutually exclusive.