 Executive Summary
Although rates of chronic absence among California’s kindergartners have declined from their peak of 40.4% in the 2021-22 school year to 23.1% in 2024-25, rates remain nearly 1.5 times as high as they were in 2018-19.  Reducing chronic absence in kindergarten is particularly urgent given the negative downstream effects it can have on students’ future educational outcomes. This report presents new findings on the persistence of chronic absence between kindergarten (K) and 1st grade across California. We show (1) how prevalent persistent chronic absence is between K and 1st grade, underscoring the need to tackle chronic absence early before negative impacts on learning and development accumulate; (2) how strongly chronic absence in K predicts chronic absence in 1st grade overall and by student groups, highlighting particular groups that need targeted assistance in order to break the cycle of chronic absence; and (3) how the relationship between K and 1st grade chronic absence changed before and after the Covid-19 pandemic, demonstrating that the relationship is potentially malleable.
Key Findings
Finding 1
Persistent chronic absence — students chronically absent in both K and 1st grade — affects nearly one out of six kindergartners in California, and it has become more common.
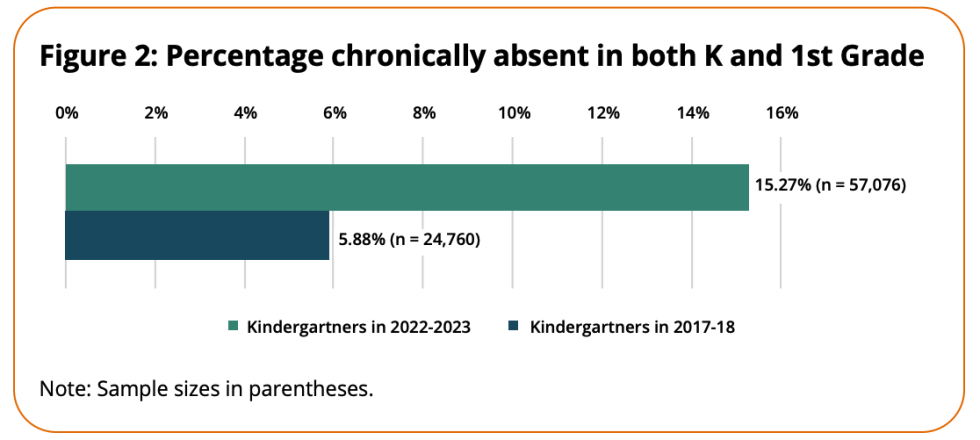
- In 2022-23, about one out of six kindergartners (15%) was chronically absent in both K and 1st grade. This represents over a twofold increase from the rate in 2017-18 (6%). Persistent chronic absence has increased the most among English language learners and migrant students as well as Asian and Filipino students. Given these increases, there should be an intentional focus on reducing absences in K to break this cycle.
Finding 2
Chronically absent kindergartners are more likely to remain chronically absent in 1st grade.
- Chronically absent kindergartners were 7.2 times more likely to be chronically absent in 1st grade versus nonchronically absent kindergartners. Given this, schools and districts should intervene as early as possible to prevent chronic absences from persisting.
Finding 3
Before the pandemic, however, chronically absent kindergartners were slightly more likely to be chronically absent in 1st grade.
- The higher likelihood can be explained by many possibilities, including differences in the socioeconomic or racial/ethnic makeup of kindergartners in the pre- versus postpandemic years. It may also suggest chronic absence is malleable, with the relationship between K and 1st grade chronic absences decreasing from before to after the pandemic because efforts to intervene were successful.
Finding 4
Chronically absent kindergartners experiencing homelessness and from socioeconomically disadvantaged backgrounds face higher risks of remaining chronically absent in 1st grade. By race and ethnicity, higher risks were also found for chronically absent kindergartners identifying as Black, American Indian or Alaskan Native, Pacific Islander, and Hispanic or Latino.
- Chronically absent kindergartners experiencing homelessness and from socioeconomically disadvantaged backgrounds1 faced a 50% chance of chronic absence in 1st grade.
- Black kindergartners who were chronically absent faced the highest chance (a 57% chance) of remaining chronically absent in 1st grade relative to students from all other racial/ethnic groups.
- Relative to all kindergartners, Black, Native American or Alaskan Native, Pacific Islander, and Hispanic or Latino kindergartners who were chronically absent faced a higher risk of remaining chronically absent in 1st grade. Among these groups, chronically absent Hispanic and Latino kindergartners make up the largest population facing a heightened risk of remaining chronically absent in 1st grade, and they will require intensive supports early on in order to break the cycle of chronic absence.
Implications for Action
Given these findings, we recommend several actions for the state as well as counties and districts:
- Intentionally focus on reducing kindergarten absences as this has the potential to break the cycle of persistent absence.
- Identify and address reasons for kindergarten absences, focusing on root causes, especially at the family and community levels.
- Use data to determine where to target supports to schools and student groups, and what types of partners and resources are needed to engage and address their attendance barriers. When targeting supports, take into account information about student groups with a greater risk of persistent chronic absence alongside the number of students in those groups.
- Expand awareness among families about the value of daily attendance for learning and development, especially during the transition to kindergarten.
- Identify and implement promising practices, including family engagement strategies as well as identifying and addressing barriers to attendance during transitions (into K and between K and 1st grade), which can help reduce absences in early grades.
Introduction
Why do kindergarten absences matter in California?
The statewide chronic absence rate2 for kindergartners remains stubbornly high — nearly 23% in 2024-25 — despite a 17 percentage point decline since 2021-22 (Figure 1). Reducing chronic absence among kindergartners is an urgent need across the state, because early grade absences occur during a crucial developmental period that sets the foundation for later outcomes; if children miss these early developmental opportunities, this can lower their socioemotional and achievement outcomes in a negative developmental cascading effect.3
 The drivers of absences in kindergarten are multifaceted and involve factors related to individual students, their families, their schools and broader communities.4 The key correlates of kindergarten absences include students’ health status, their learning approaches (e.g., eagerness to learn, persistence in completing tasks and ability to focus on tasks), and their parents’ socioeconomic status. Kindergarten also represents a unique transitional period where students may face higher rates of absences due to several interrelated factors. First, many families may not recognize the importance of consistent attendance in kindergarten for their children’s growth and development. For instance, only about a third of English-speaking parents agree that being absent from kindergarten is “a big deal”.5 Second, attendance of kindergartners relies more heavily on the support of caregivers and family members including siblings; as a result, absences could increase if these caregivers face language barriers in communicating with schools as well as broader economic or social challenges in their lives. Finally, we know that factors driving attendance can vary by student and family background, so understanding which students experience the highest levels of chronic absence can help California target its resources more effectively to improve educational outcomes.
Data and Method
We used anonymized longitudinal student-level data from the California Department of Education for students who were kindergartners6 in 2022-23 and in 1st grade in 2023-24 (N = 373,758). We also compared whether this relationship was the same prior to the pandemic using data for kindergartners in 2017-18 who were in 1st grade in 2018-19 (N = 420,883). Table A1 in the appendix describes key characteristics of the samples. Additional details on the sample and methodology underlying these findings are in the Technical Appendix.
Report Questions
Our report answers the following questions:
- How prevalent is persistent chronic absence between K and 1st grades?
- What is the probability that chronically absent kindergartners will be chronically absent in 1st grade? Which student groups face a higher probability?
Findings
 How prevalent is persistent chronic absence between K and 1st grades?
Finding 1: Persistent chronic absence affects nearly one out of six kindergartners in California, and it has become more common.
 As shown in Figure 2, nearly one out of every six kindergartners in 2022-23 (15.3%) was chronically absent in both K and 1st grades. This has become more common — prior to the pandemic, about one out of 15 kindergartners (5.9%) experienced persistent chronic absence.
In comparing rates for student groups between 2017- 18 and 2022-23 (Figures 3 and 4), persistent chronic absence increased for all groups, with rates increasing the most for English language learners, migrant students and students who are Asian or Filipino. Migrant students experienced a threefold increase while Asian and Filipino students experienced about a 3.5-fold increase. In terms of numbers of students, these increases represent an additional 8,429 English language learners; 167 migrant students; and 1,571 Asian and 406 Filipino students who were persistently chronically absent in 2022-23 relative to 2017-18.
What is the probability that chronically absent kindergartners will be chronically absent in 1st grade? Which student groups face a higher probability?
Finding 2: Chronically absent kindergartners are more likely to remain chronically absent in 1st grade.
As shown in the top panel of Figure 5, chronically absent kindergartners in 2022-23 had a 41.2% chance of remaining chronically absent in 1st grade. The chances for nonchronically absent kindergartners was significantly lower at 5.7%. In relative terms, this means that chronically absent kindergartners were 7.2 times more likely to be chronically absent in 1st grade versus their nonchronically absent peers.
Finding 3: Before the pandemic, chronically absent kindergartners were more likely to be chronically absent in 1st grade.
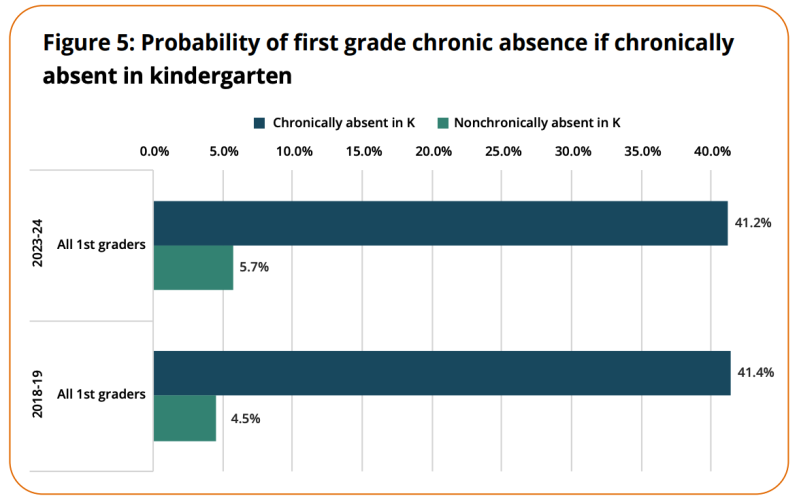 Pre-pandemic, this likelihood was even higher. Chronically absent kindergartners were 9.2 times more likely to be chronically absent in 1st grade versus their nonchronically absent peers (a 41.4% chance if chronically absent in K versus a 4.5% chance if not chronically absent in K). While these analyses cannot tell us why the likelihood was higher, it could be due to differences in the demographic makeup (e.g., socioeconomic status or race/ethnicity) in the pre- versus postpandemic cohorts. Another possibility is that efforts to intervene and prevent future chronic absence were successful.
Student groups: Homeless, socioeconomically disadvantaged, English language learner and migrant students
Finding 4: Chronically absent kindergartners experiencing homelessness and from socioeconomically disadvantaged backgrounds face higher risks of remaining chronically absent in 1st grade. By race and ethnicity, higher risks were also found for chronically absent kindergartners identifying as Black, American Indian or Alaskan Native, Pacific Islander, and Hispanic or Latino.
 As with the overall findings, each student group in 2022-23 faced a higher chance of chronic absence in 1st grade, with the chances varying across groups (Figure 6). Notably, relative to other student groups, students experiencing homelessness who were chronically absent in K had the highest probability of remaining chronically absent in 1st grade — just above a 50% chance. In other words, every one out of two homeless students who were chronically absent in K was predicted to be chronically absent in 1st grade. This is followed by socioeconomically disadvantaged (SED) youth, who faced a 47% chance. In contrast, the chance for migrant youth was around 40%, which is slightly lower than the chance for all kindergartners (41%). In terms of the sizes of these student groups to which these probabilities apply, there were 7,321 homeless; 99,521 SED; and 945 migrant kindergartners who were chronically absent in 2022-23 (see Table A1 in the appendix for other group sizes).
 For comparative purposes, Figure 7 displays findings for the prepandemic cohort of kindergartners in 2017-18. For socioeconomically disadvantaged (SED) students and English language learners (ELLs) who were chronically absent in kindergarten, their chances of chronic absence in 1st grade were comparable pre- and postpandemic (about 47%). However, homeless and migrant students faced a higher risk of remaining chronically absent between kindergarten and 1st grade, postpandemic. For example, students experiencing homelessness who were chronically absent in kindergarten faced a 51% chance of chronic absence in 1st grade in 2023-24 versus a 48% chance in 2018-19, a 3 percentage point difference.
Racial and Ethnic Groups
 By race and ethnicity, the overall link between K and 1st grade chronic absence remains consistent — chronically absent kindergartners of each racial and ethnic background were more likely to be also chronically absent in 1st grade (Figure 8). Black kindergartners who were chronically absent faced the highest chance (57%) of being chronically absent in 1st grade. This is followed by American Indian or Alaskan Native students (55%) and Pacific Islander students (55%). In terms of numbers of students to which these probabilities apply, there were 7,945 Black, 691 American Indian or Alaskan Native, and 719 Pacific Islander kindergartners who were chronically absent in 2022-23.
 For comparative purposes, Figure 9 displays findings for the prepandemic cohort of kindergartners in 2017-18. Notably, postpandemic, Black, American Indian or Alaskan Native, Pacific Islander and Asian kindergartners who were chronically absent faced a higher risk of remaining chronically absent in 1st grade. For example, Black kindergartners who were chronically absent had a 57% chance of remaining chronically absent in 1st grade in 2023- 24, while in 2018-19 they had a 55% chance, a 2 percentage point increase. For American Indian or Alaskan students, the post- versus prepandemic difference was about 4 points (55% versus 51%), while for Pacific Islander students, the difference was 6 points (55% versus 49%). Finally, for Asian students the difference was 2 points (28% vs. 26%).
Implications
Given these findings, we recommend several actions:
- Intentionally focus on reducing kindergarten absences, as this has the potential to break the cycle of persistent absence. Based on evidence from the “Attendance Playbook”7 by FutureEd and Attendance Works, several approaches have shown promising results in reducing kindergarten absences, including: (1) universal free meals; (2) breakfast in the classroom; (3) individualized tutoring in literacy and reading skills; and (4) socioemotional curricula.
- Identify and address reasons for kindergarten absences, focusing on root causes, especially at the family and systemic levels.
- Systemic barriers to attendance include lack of access to preschool experiences, unreliable transportation, unaffordable health care, unstable housing, poor nutrition and exposure to instability due to trauma.8
- At the family-level, one root cause could be parental perceptions of kindergarten. Schools and districts can help families better understand what their children are learning every day and why consistent attendance in kindergarten is so crucial to future academic success.9 Language barriers may also be relevant, so ensuring that communicating with families in their home languages is critical.10
- At the community level, parental perceptions of safety may also be a determining factor, especially among families impacted by recent increases in immigration raids. These raids have been linked to significant increases in the absences of younger learners.11
- Use data to target supports to kindergartners and families facing a greater risk of persistent chronic absence. Consider risk alongside the size of the groups affected. For example, Hispanic or Latino kindergartners are one of the largest groups experiencing a higher risk of persistent chronic absence.
- Expand awareness among families about daily attendance for learning and development, especially during the transitions into kindergarten. Attendance Works has developed a toolkit to actively partner and engage with families of early learners: “Early Matters: Cultivating Engagement and Attendance in Kindergarten.”
- Continue to identify promising conditions and practices to support kindergarten attendance. The California Collaborative for Education Excellence (CCEE) has identified common conditions and approaches of three “bright-spot” districts in California, which may contribute to lower kindergarten chronic absence rates.
- Common conditions include:
- Supportive leadership
- Intentional data use
- Cross-departmental attendance teams
- Common approaches include:
- Building trust and engagement between schools and families
- Establishing positive school climates that focus on supporting students’ socioemotional wellbeing
- Developing clear guidance on supporting students’ health
Family engagement initiatives also show promise in reducing kindergarten absences. California schools situated in districts that increased their capacity to build stronger relationships with parents have lower kindergarten chronic absence rates.12
Endnotes
- This accountability subgroup includes students who met at least one of the following criteria: (1) neither of the student’s parents has received a high school diploma (2) the student is eligible for or participating in the free meal program or reduced-price meal program (3) the student is Title I Part C migrant (4) the student was considered homeless (5) the student was foster program eligible (6) the student was directly certified (7) the student was enrolled in a juvenile court school and (8) the student is eligible as tribal foster youth.
- This rate is based on, “…the percentage of students who were absent for 10% or more of the instructional days they were enrolled to attend.” (CDE, 2024). This includes absences for any reason. Students need to be enrolled for at least 31 instructional days to be included in counts of students experiencing chronic absence counts.
- Ansari, A., Hofkens, T.L., & Pianta, R.C., “Absenteeism in the First Decade of Education Forecasts Civic Engagement and Educational and Socioeconomic Prospects in Young Adulthood,” Journal of Youth and Adolescence (June 2020), 49,1835-1848.
- Gee, K. A., “What Contributes to the Variation in Chronic Absenteeism Across the Early Elementary Years? Understanding the Role of Children, Classrooms and Schools,” Absent from School: Understanding and Addressing Student Absenteeism (2019). Harvard Education Press.
- Ad Council, “California Attendance Parent Survey Results,” (August 2015).
- The sample included approximately 6,000 students in transitional kindergarten (TK) in 2022-23 and 2,600 TK students in 2017-18. See the appendix for further details. The results reported here are inclusive of TK students. Results are similar without including TK students.
- Jordan, P., “Attendance Playbook: Smart strategies for reducing student absenteeism post-pandemic,” (May 2023). FutureEd and Attendance Works.
- Ansari, A., Childs, J., Gee, K. A., Gottfried, M. A., Hutt, E. & Lenhoff, S., “Before the Bell: Obstacles preventing children from attending school,” (November 2024).
- Ehrlich, S. B., Gwynne, J. A., Pareja, A. S., Allensworth, E., Moore, P.T., Jagesic, S. & Sorice, E., “Preschool Attendance in Chicago Public Schools: Relationships with learning outcomes and reasons for absence,” University of Chicago Consortium on Chicago School Research (September 2013).
- Escobedo, Monique, “2025 Early Learner Attendance Report: Latino TK/Kindergarten Attendance Under Pressure in California,” Parent Institute for Quality Education (PIQE) (2025).
- Dee, T. S., “Recent Immigration Raids Increased Student Absences,” Proceedings of the National Academy of Sciences (November 2025), 122(45), e2510395122.
- Gee, K. A., “Districtwide Family Engagement Strategies & Chronic Absenteeism Among Kindergartners & Multilingual Learners: Insights from California,” SREE 2025 Conference, Chicago, IL, United States (October 2025).
Appendix
Table A1. Table of Descriptive Statistics
| Measure |
K Cohort
2022-23
(%) |
|
K Cohort
2017-18
(%) |
|
| Chronic absence in 1st grade (2023-24 SY) |
19.1 |
|
10.1 |
|
| Chronic absence in K (2022-23 SY) |
34.1 |
|
12.6 |
|
| Log-scaled expenditures (mean) |
9.92 |
|
9.47 |
|
| Log-scaled enrollment (mean) |
6.36 |
|
6.41 |
|
| Locale |
| City |
37.4 |
|
39.2 |
|
| N/A |
9.0 |
|
7.6 |
|
| Rural |
6.4 |
|
5.8 |
|
| Suburb |
41.2 |
|
41.4 |
|
| Town |
6.1 |
|
5.9 |
|
| Gender |
| Female |
48.9 |
|
48.9 |
|
| Male |
51.1 |
|
51.1 |
|
| Other |
0.02 |
|
N/A |
|
| Race/Ethnicity |
|
Number Chronically Absent in K |
|
Number Chronically Absent in K |
| Asian |
9.9 |
7,531 |
9.4 |
2,334 |
| Black |
4.6 |
7,945 |
5.1 |
5,209 |
| Not reported |
1.6 |
1,847 |
1.1 |
582 |
| Filipino |
1.9 |
1,981 |
2.1 |
701 |
| Hispanic or Latino |
56.2 |
83,209 |
55.0 |
32,764 |
| American Indian or Alaskan Native |
0.4 |
691 |
0.5 |
452 |
| Pacific Islander |
0.4 |
719 |
0.4 |
472 |
| Two or more races |
5.3 |
5,588 |
4.5 |
2,098 |
| White |
19.7 |
17,900 |
22.1 |
8,246 |
| Socioeconomically disadvantaged |
65.2 |
99,521 |
63.5 |
43,427 |
| Homeless |
4.2 |
7,321 |
3.9 |
3,826 |
| English language learner |
26.8 |
34,988 |
32.6 |
15,489 |
| Migrant |
0.9 |
945 |
0.9 |
397 |
| Moved |
6.4 |
N/A |
6.5 |
N/A |
| N |
373,758 |
|
420,883 |
|
Sample, Methods and Limitations
Sample inclusion criteria. The sample includes only students in traditional public schools. This was determined by merging the student-level data with Public Schools and Districts Data Files, and retaining students whose school was coded as Traditional (TRAD) under the EdOpsCode field.
Inclusion of TK students. The sample includes n = 6,061 students in transitional kindergarten (TK) in 2022- 23 and n = 2,685 TK students in 2017-18. A majority of TK students (n = 4917) in 2022-23 repeated TK from the prior year. Results in this report are based on samples that include TK students. All results were reestimated using samples without TK students and are very similar to those included in this report (results are available from the author upon request).
Methods. To estimate the prevalence of persistent absenteeism, we used descriptive methods. To estimate the link between chronic absence in K and 1st grade, we used logistic regression analysis where we regressed students’ chronic absence status in 1st grade (1 = chronically absent; 0 = not chronically absent) based on their chronic absence status in kindergarten, controlling for observed student demographic characteristics (race and ethnicity, gender, mobility and economic disadvantage) alongside school- and district-level characteristics, including the school size, district expenditures per average daily attendance (ADA) and geographic locale (city, suburb, rural or town).
Then, we conducted these analyses stratified by race/ ethnicity as well as by four student groups: homeless, socioeconomically disadvantaged, English language learner and migrant. Standard errors were clustered by school. Based on these models, fitted probabilities of being chronically absent were estimated, holding all included covariates at their means.
Limitations. An important limitation of this study is that we are unable to establish a causal relationship given that absences in 1st grade are also driven by many other factors, both observed and unobserved.4 Thus, these findings should be interpreted as only capturing a correlation between K and 1st grade chronic absences.
Acknowledgements
The authors would like to thank the California Department of Education (CDE), especially Jonathan Isler and Piper Stanger for their invaluable support with the data as well as insightful feedback on prior drafts of our findings. We also appreciate the feedback and support from Cindy Kazanis, Kim Mundenk and Michael Ishimoto at CDE alongside the members of the Chronic Absence and Attendance Partnership (CAAP). Special thanks to Gisela Ariza and Catherine Cooney from Attendance Works for sharing their expert insights on prior drafts of this report, and to Peter Yu at UC Davis who helped prepare the data for analysis. We appreciate the Attendance Works creative team: Catherine Cooney, who led the editing, design, production and distribution, Sarah Osolin for her careful proofing skills, Lisa Ferber for her thoughtful copyediting and Rhonda Saunders for the report design. Finally, we acknowledge both Families in Schools (FIS) and Parent Institute for Quality Education (PIQE) for their ongoing partnership in tackling kindergarten and early grade chronic absence.
This report was made possible through generous financial support from the Heising Simons Foundation. All analyses, conclusions and recommendations in the report are those of the authors.
About the Organizations
Attendance Works is a national nonprofit initiative that advances success in school and beyond for all students by inspiring and catalyzing policies and practices that prevent and reduce chronic absence. Its website offers a wide array of free materials, tools, research and success stories to help schools, districts and communities work together to reduce chronic absence.
The School Policy, Action, and Research Center (SPARC) at UC Davis generates research leading to actionable insights that can support the educational wellbeing of vulnerable youth. Our work supports children experiencing adverse life and social circumstances, including Asian American and Pacific Islander youth who have been bullied, children experiencing chronic absenteeism, and child welfare-involved youth who have experienced maltreatment.
Citation: K. Gee, H. N. Chang and C. Leong, ”The Persistence of Chronic Absence Between Kindergarten and 1st grade in California: Insights to Break the Cycle of Absenteeism,” Attendance Works, January 2026.
The content that appears on this webpage is the same as the printed research brief, without the stock images. Copyright © 2026 Attendance Works, All rights reserved.

